ICCT: PHEVs electrify many trips, but currently emit on average 2-4 times more CO2 than advertised
Plug-in hybrid electric vehicles (PHEVs), which combine an electric and a conventional combustion engine drive train, offer the potential to reduce global greenhouse gas (GHG) emissions and local air pollution if they drive mainly on electricity. However, there is limited evidence on how much driving PHEVs actually do on electricity and how much conventional fuel they use in real-world operation. ICCT’s White Paper undertook analysis of real-world usage and fuel consumption of approximately 100,000 PHEVs in China, Europe, and North America and came to the following main findings:
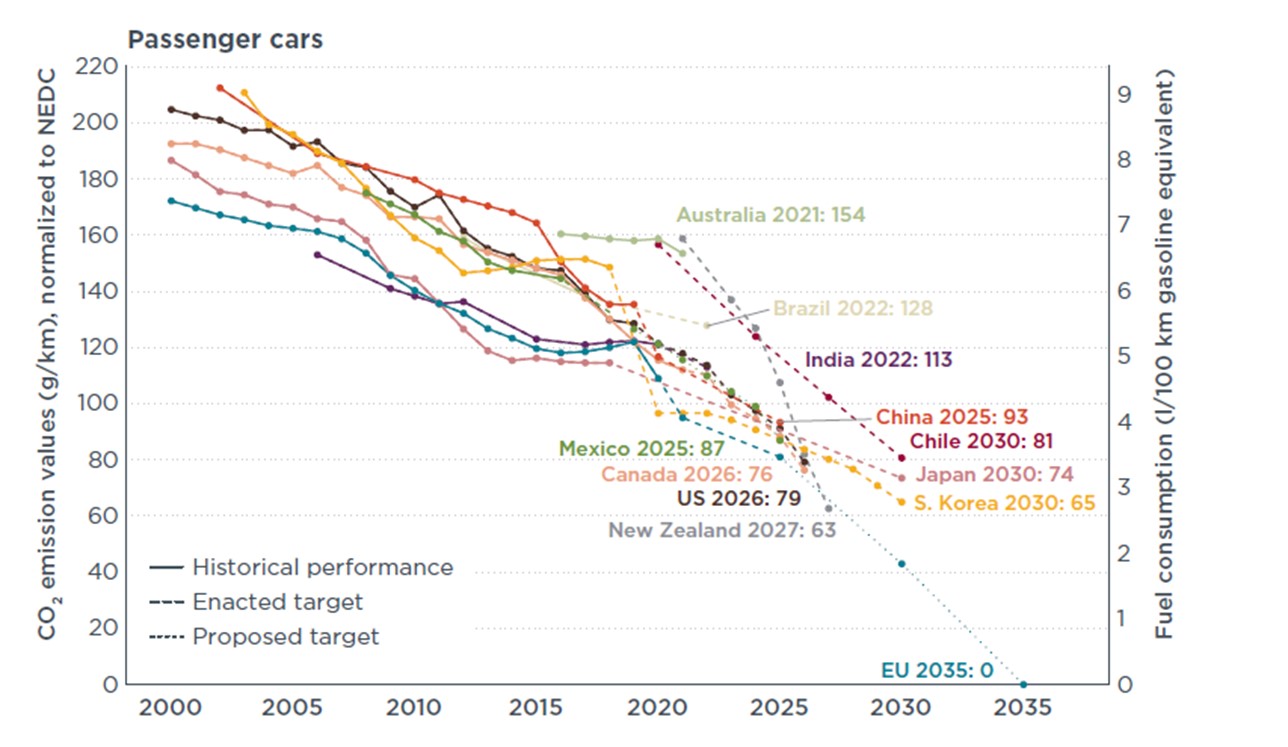
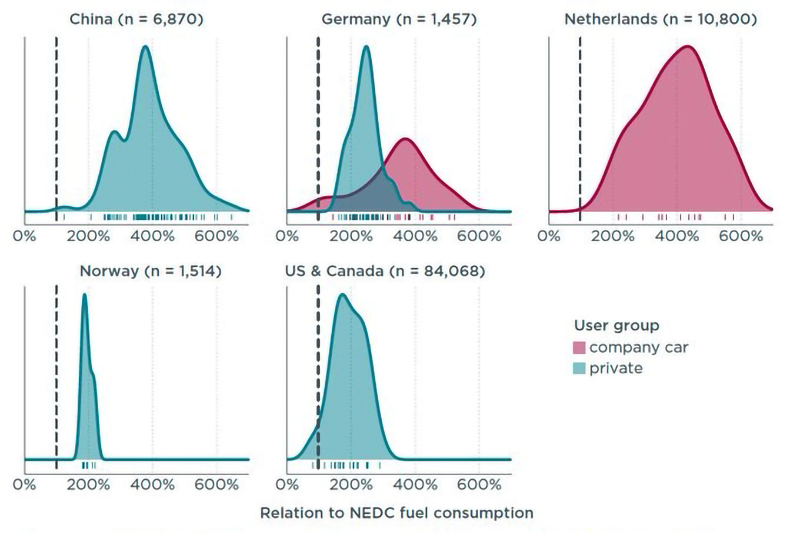
PHEV fuel consumption and tail-pipe CO2 emissions in real-world driving, on average, are approximately two to four times higher than type-approval values. The deviation from New European Drive Cycle (NEDC) type-approval values spans much larger ranges than for conventional vehicles. Real-world values are two to four times higher for private cars and three to four times higher for company cars.
The real-world share of electric driving for PHEVs, on average, is about half the share considered in the type-approval values. For private cars, the average utility factor (UF)—the portion of kilometers driven on electric motor versus kilometers driven on combustion engine—is 69% for NEDC type approval but only around 37% for real-world driving. For company cars, an average UF of 63% for NEDC and approximately 20% for real-world driving was found. There are noteworthy differences between the markets analyzed, with the highest real-world UF found for Norway at 53% for private vehicles and the United States at 54% for private vehicles. The lowest UFs were for China at 26% for private vehicles, Germany with 18% for company cars and 43% for private vehicles, and the Netherlands with 24% for company cars.
PHEVs electrify many kilometers per year. Most PHEVs have type-approval all-electric ranges of 30–60 km and electrify 5,000–10,000 km a year. PHEVs with high all-electric ranges of 80 km or more achieve 12,000–20,000 km mean annual electric mileages, which is comparable to the annual mileage of the car fleet in Germany and the United States. The high annual electric kilometers reflect high annual mileages of PHEVs despite low UFs. The share of kilometers that PHEVs electrify results in a total of 15%–55% less tailpipe CO2 emissions compared to conventional cars. This is much lower than expected from type-approval values.
Decreasing combustion engine power while increasing all-electric range and frequency of charging improve real-world fuel consumption and CO2 emissions of PHEVs. Real-world fuel consumption and CO2 emission levels decrease by 2%–4% with each 10 kW of system power taken out of a PHEV. At the same time, adding 10 km of all-electric range improves real-world values by 8%–14%.
Reference: Plötz, P., Moll, C., Bieker, G., Mock, P., Li, Y. (2020) Real-world usage of plug-in hybrid electric vehicles: Fuel consumption, electric driving, and CO2 emissions ICCT White Paper, September 2020 https://theicct.org/sites/default/files/publications/PHEV-white%20paper-sept2020-0.pdf