


The South African Developing Automotive Fuel Economy Policy
1.1 Background
Transport emissions are growing globally, with severe externalities associated with not only emissions but with the entire sector. It is estimated the costs of such externalities to be approximately R34 to 55 million per year. Of particular importance, especially to this case study, is the impact of vehicle emissions on human health, particularly pollutants such as particulates, sulfur dioxide and nitrogen oxides in urban areas, estimated to cost around R 10 billion per year.
After a period of relatively low prices for crude oil, there have been significant price increases during 2004. This has caused economic and social hardship throughout the community and has put pressure on the government to seek ways to reduce prices on fuels and refined products. The outlook for oil prices is uncertain, with most commentators predicting further price increases. This allied with possible volatilities in the Rand/Dollar exchange rate make the setting of economic targets extremely difficult for government.
Transport was responsible for 27% of final energy demand in 2000. Petroleum products represented 97% and electricity 3% of energy demand in this sector. Road transport represents 84% of energy use.
Petrol and diesel are mainly used for road transport of passengers and freight. In terms of primary energy supply, nearly 80% is from imported oil - crude oil represents the single largest import item on South Africa's import account.
1.2 The South African Light-Duty Vehicle Fleet
Transport is a growing energy consuming sector in the country and is expected to grow considerably in the medium-term. Measures to address energy efficiency will not necessarily be easy to implement, as has been the experience internationally where motor vehicles have become the main means of transport. The projected savings will, therefore, only begin to impact during Phase 2 when planned interventions have been implemented fully. The majority of the measures will be regulatory in nature, but in order to be effective will rely heavily upon behavioral changes. Such changes are, by experience, the most intractable elements to influence.
A target of 9% has, therefore, been established as a realistic but challenging objective for 2014.
This target has assumed the introduction of a labeling system, effective July 2008, for all new passenger cars offered for sale in South Africa. Vehicles are required to display a windscreen label informing prospective buyers how fuel efficient each vehicle is as measured in terms of the EU 'Combined Cycle' and the corresponding amount of carbon dioxide emitted. A data base of new vehicle fuel economy and CO2 emission figures is maintained on the National Association of Vehicles manufacturers of South Africa (NAAMSA) web site.
This labeling system displays vehicle energy consumption accompanied by legislation on the 'fee bate system', technology upgrade leading to more efficient vehicles/turnover in the vehicle park, but has excluded taxi-recapitalisation. As the impacts of taxi-recapitalisation may only be evident in the later phases of this Strategy the target would be reviewed in Phase 3. The impact of measures such as moving road to rail and spatial planning are also difficult to assess at this stage and remain interventions with impacts in the long-term.
1.3 Status of LDV fleet fuel consumption/CO2 emissions
The majority of local air pollution in South Africa is mainly a consequence of fuel burning, which includes industrial and commercial fuel burning, petrol and diesel combustion in vehicles, domestic fuel burning, coal-fired electricity generation and biomass burning. In 2006, emissions from vehicles contributed 44% of the total nitrous oxide emissions and 45% of the total national NMVOC (non-methane volatile organic compounds) emissions, which contribute to the creation of photochemical smog.
South Africa has considered a number of policies, while looking at the measures that Europe has taken. One of the most effective policies is to increase the share of diesels in the market. This can be seen with Europe having around 50% diesel penetration. The market is well developed. Diesel fuel quality in South Africa, which was of concern, is now coming in line with European standards and ownership costs of diesel vehicles should also come into line with their petrol equivalents. It is estimated that a 25% diesel vehicle market share would result in a savings of around 33.75 million litres of fuel per annum in 2010.
2.0 Regulatory Policies
2.1 National Standard
There are no national fuel consumption standards in South Africa.
2.2 Import restrictions
New Vehicles
N/A
Second Hand
According to the South African Revenue Service, a second hand vehicle may only be imported if an Import Permit is obtained from the International Trade Association Commission (ITAC) of South Africa and a Letter of Authority from South Africa's National Regulator for Compulsory Specifications (NRCS).
2.3 Technology mandates/targets
There are no technology mandates in South Africa.
3.0 Fiscal Measures and Economic Instruments
3.1 Fuel Taxes
Petrol, diesel and biodiesel are classified as fuel levy goods, in terms of the Customs and Excise Act, No. 91 of 1964, and are therefore subject to fuel taxes and levies. However, they are zero rated for VAT purposes. Fuel taxes exist in South Africa in the form of a general fuel levy, instituted at the national level. For petrol fuel there is a levy of 116 cent per litre, diesel at 100 cent per litre, and biodiesel at 60 cent per litre. This general fuel levy is determined by the Minister of Finance in the annual budget, and is used to finance general government expenditure programmes. The fuel levy acts, indirectly, as an incentive to reduce air pollution externalities caused by vehicle emissions. By increasing the price of fuel, consumer demand is suppressed to the extent that the demand for transport fuels is responsive to change in price. With higher fuel prices, there is a disincentive for private vehicle use, and in incentive for use of public transport or vehicle sharing. Cleaner, more fuel efficient technologies will be incentivized when cost-savings are measured against the higher overall cost for the technology. Further, as of 7th April, 2010, fuel taxes, including the road accident fund, will increase by 25.5 cents per litre.
Bio-fuels have made a huge market share jump in the last decade, with countries such as Brazil, blending up to 75% of petrol with bio-fuel (see: Section II on Biofuels and Brazil Case study). Given the potential long-term benefits of biodiesel, a favourable fuel tax treatment was announced in the 2002 South African budget in an attempt to reduce the cost disadvantages that biodiesel currently faces with respect to fossil fuels. The intention is to give a similar fuel tax dispensation for bioethanol in the future.
3.2 Fee-bate
N/A
3.3 Buy-back
N/A
3.4 Other tax instruments
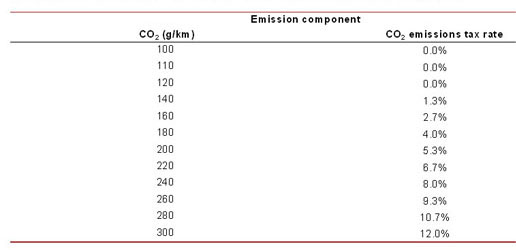
The new budget for 2010 recommends that the 2009 ad valorem CO2 emission tax on new passenger motor vehicles be converted into a flat rate CO2 emissions tax, effective from September 1st, 2010. The objective of the new CO2 emission tax is to influence the composition of South Africa's vehicle fleet to become more energy efficient and environmentally friendly. This tax will be implemented as a specific tax, based on new passenger car certified CO2 emissions at R75 per g/km for each g/km above 120 g/km, in addition to the current ad valorem luxury tax on new vehicles. Essentially, any gram of CO2 a passenger vehicle releases above the 120 g/km threshold will attract a penalty of R75. However, critics argue that without clean fuels, the promotion of vehicles with lower CO2 emissions will not work. The CO2 emissions tax incidence is illustrated by the following table:
CO2 vehicle emissions tax - tax incidence.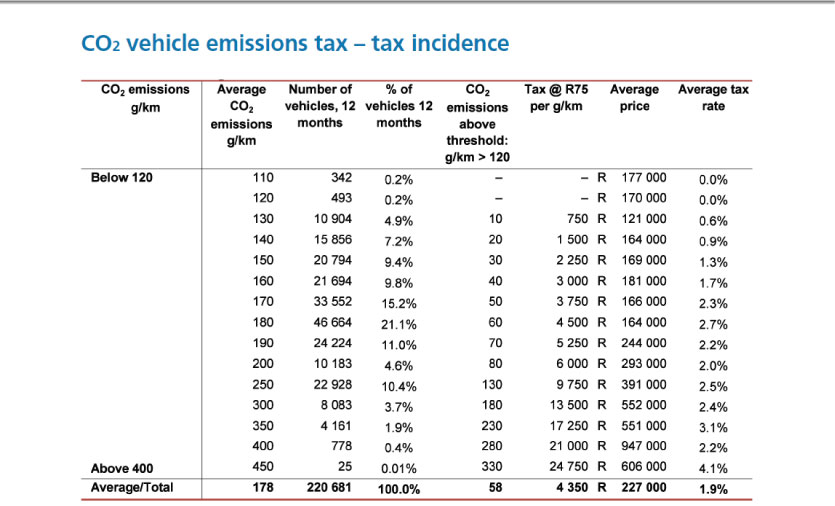
The provinces of South Africa have exclusive responsibility under the Constitution for provincial road management and traffic control. The Road Traffic Act of 1996 with its relevant regulations gives provincial governments authority to impose certain road traffic fees. The Road Traffic Act fees are divided into four categories: motor vehicle licenses that include all categories of vehicles; operator licenses that include learners and driver's licenses; roadworthy; and motor vehicle registration. The provinces also have the authority to set the level of these fees and appoint registering agents to collect the fees on behalf of the provinces.
Revenue potential from such taxes is evident from the South African experience, as the following tables illustrate:
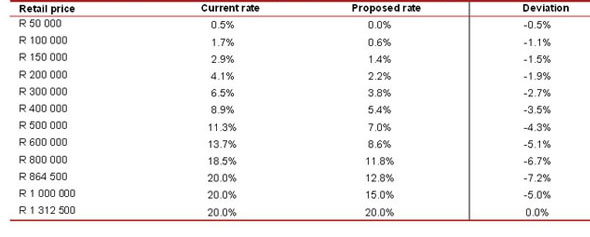
Table: Ad valorem "luxury" excise duty rates on motor vehicles.
Also, South Africa generates income from a number of environmentally-related taxes as shown by this table.
Table: Revenues from environmentally-related taxes in South Africa.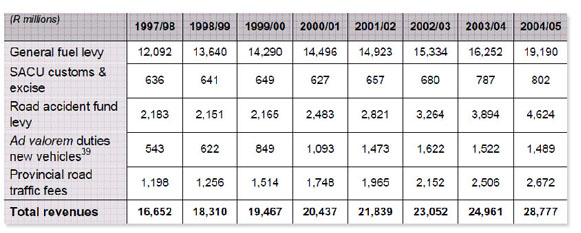
Source: South African National Treasury. A Framework for Considering
Market-Based Instruments to Support Environmental Fiscal Reform in
South Africa. South African National Treasury. 2006. Accessed 18 Feb. 2010
Indeed, in the South African case, revenue generation was the main reason behind environmentally-related taxes, with environmental protection as an added bonus to such taxes.
3.5 Registration fees
N/A3.6 R&D
N/A4.0 Traffic Control Measures
4.1 Priority lanes
N/A4.2 Parking
N/A4.3 Road pricing
N/A5.0 Information
5.1 Labeling
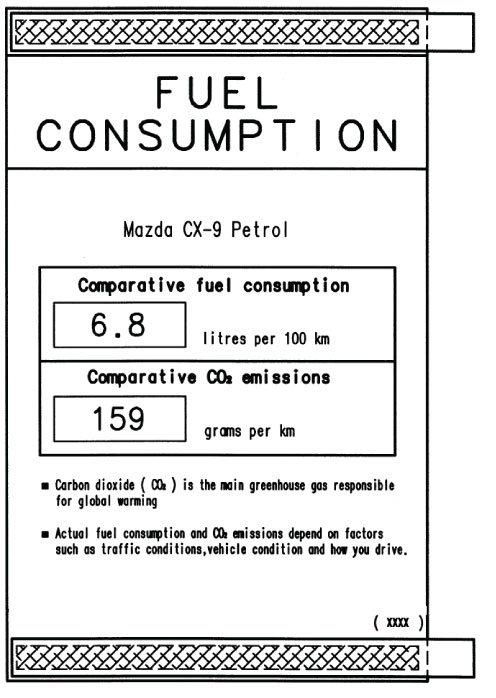
As of 2008, all car dealers in South Africa will have to display stickers on the windscreens of new cars, informing prospective buyers how fuel efficient each vehicle is and how much carbon dioxide it emits. The labels will enable consumers to know the extent to which vehicles they buy are contributing to global climate change.
The label has to be self-adhesive and removable and of a type applicable to windscreens, and must be placed at the bottom corner of the windscreen. The fuel consumption and carbon dioxide emissions values as determined by SANS 20101: 2006 recorded in litres per 100 km and grams per km respectively.
- The South African Fuel Economy Label must feature the following points of information:
- Point of sale
- EU based
- Fuel Economy l/100 km: Combined Cycle
- CO2 emissions g/km
- Standard test cycle
- Reference fuel
- Allows model to model comparisons
5.2 Public info
The National Association of Automobile Manufacturers of South Africa (NAAMSA) has published an online database of Comparative Passenger Car Fuel Economy and CO2 Emissions Data, available from http://www.naamsa.com/ecelabels/.
5.3 Industry reporting
The National Association of Automobile Manufacturers of South Africa (NAAMSA) has published an online database of Comparative Passenger Car Fuel Economy and CO2 Emissions Data, available from http://www.naamsa.com/ecelabels/.
The text above is a summary and synthesis of the following sources:
- "Draft Energy Efficiency Strategy". Republic of South Africa Department of Minerals and Energy, April 2004. Available on-line (http://www.info.gov.za/view/DownloadFileAction?id=70151)
- Draft Policy Paper - A Framework for Considering Market-based Instruments to Support Environmental Fiscal Reform in South Africa, April 2006. Available on-line (http://www.capeaction.org.za/uploads/Framework_for_enviro_fiscal_reform_Treasury_06.pdf)
- "Budget 2010/2011 Tax Proposals." South Africa National Treasury, 2010: 9. Accessed 16 March 2010.
- Rayner, Stuart. "Fuel Economy and CO2 labeling requirements: Feb' 2008." PowerPoint Presentation.
Selected South African Legislation:
- The South African Constitution
- The White Paper on Energy Policy, 1998
- The Municipal Systems Act No. 32 of 2000
- The Electricity Act No. 41 of 1987 (as amended)
- The Draft Energy Bill
- The Standards Act
- The Draft Electricity Regulation Bill

 The information contained on this website is intended as practical guidance coupled with examples of auto fuel economy policies and approaches in use around the world. It is not a complete collection of all national examples, nor does it track national and global progress on improving auto fuel economy. It is a work in progress and is updated regularly.This website does not support IE 5 and below.
Download Flash Player